The trading journal that optimizes your strategy.
EdgeFlow counts in your own trades which confluences cost you money and which combinations made you money.
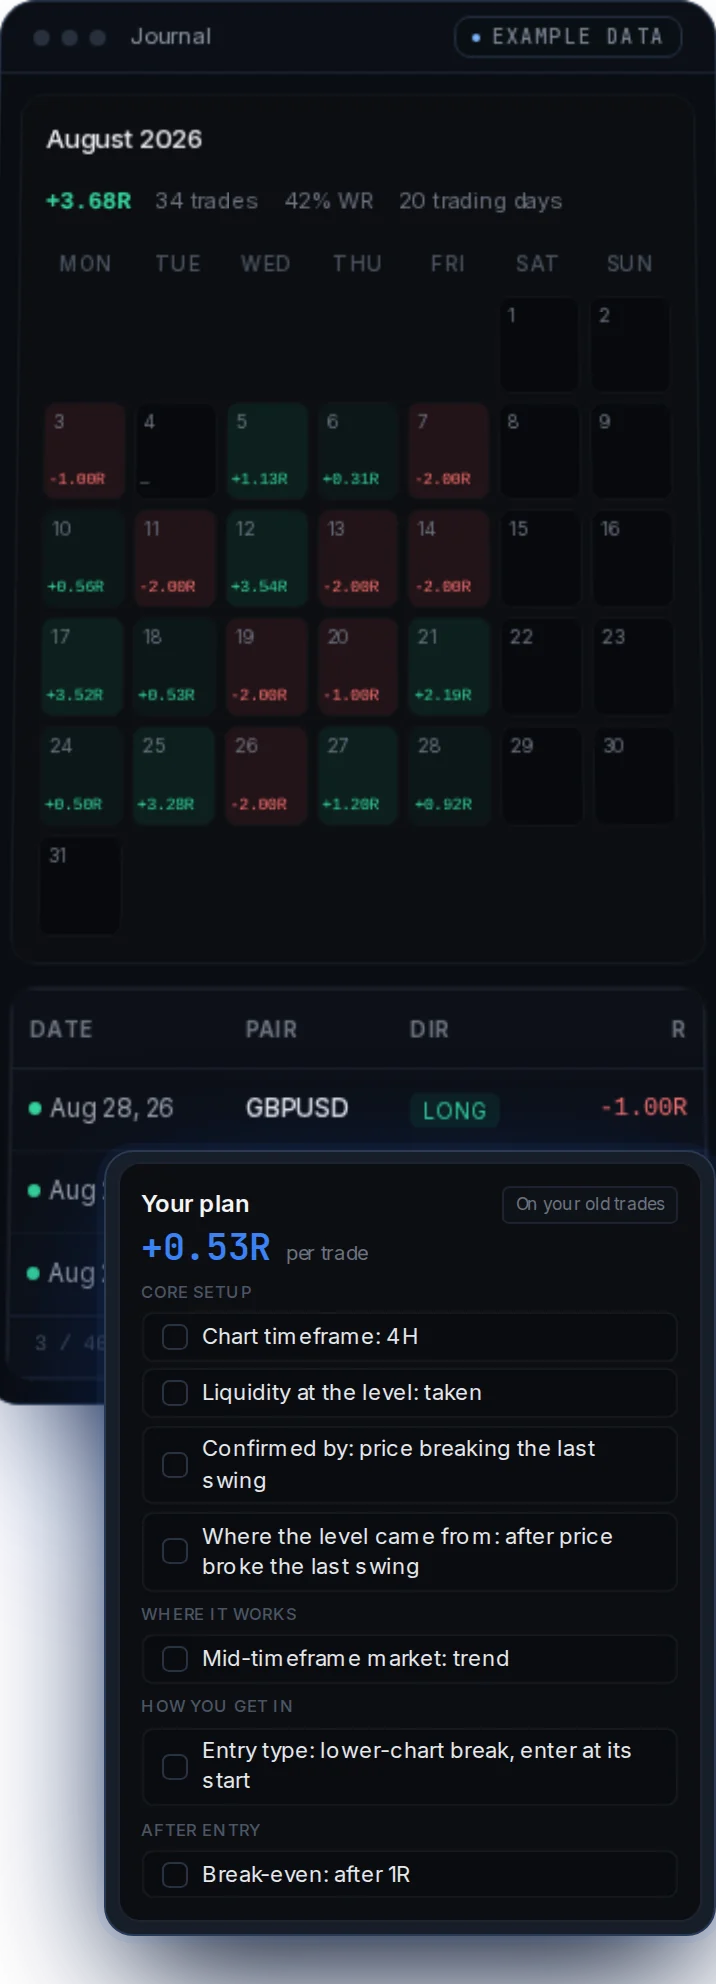
Sound familiar?
You put in the hours. Your strategy still doesn’t improve.
EdgeFlow splits every trade into four parts: setup, market, entry and after entry. You tick what you saw, and Edge Builder shows which of it made you money.
Edge Builder puts every check in one list, with what it made or cost you. You change the one that costs you and keep the rest.
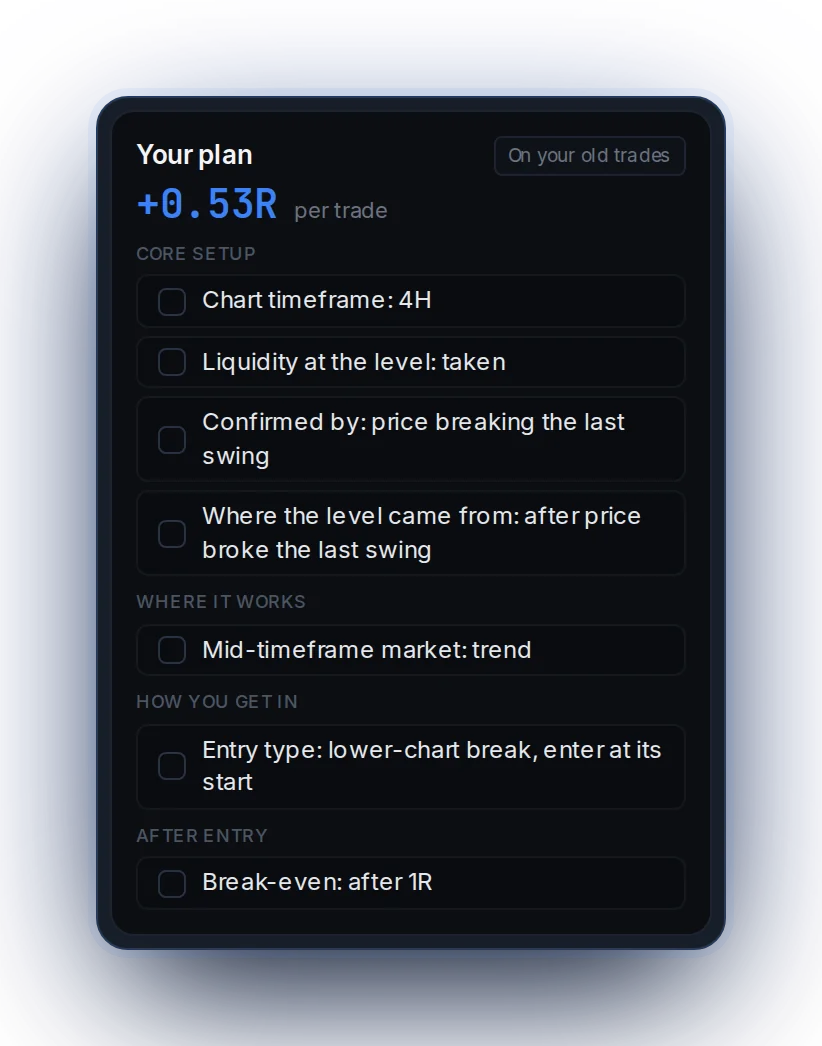
Edge Discovery turns the checks that made you money into one plan you tick before every entry. You stop deciding on feel.
EdgeFlow splits every trade into four parts: setup, market, entry and after entry. You tick what you saw, and Edge Builder shows which of it made you money.
Try the demo
Try it on an example journal.
trades, around break-even overall. Find the plan inside them. At each step the suggestion is circled.
Inside EdgeFlow
Everything in one journal.
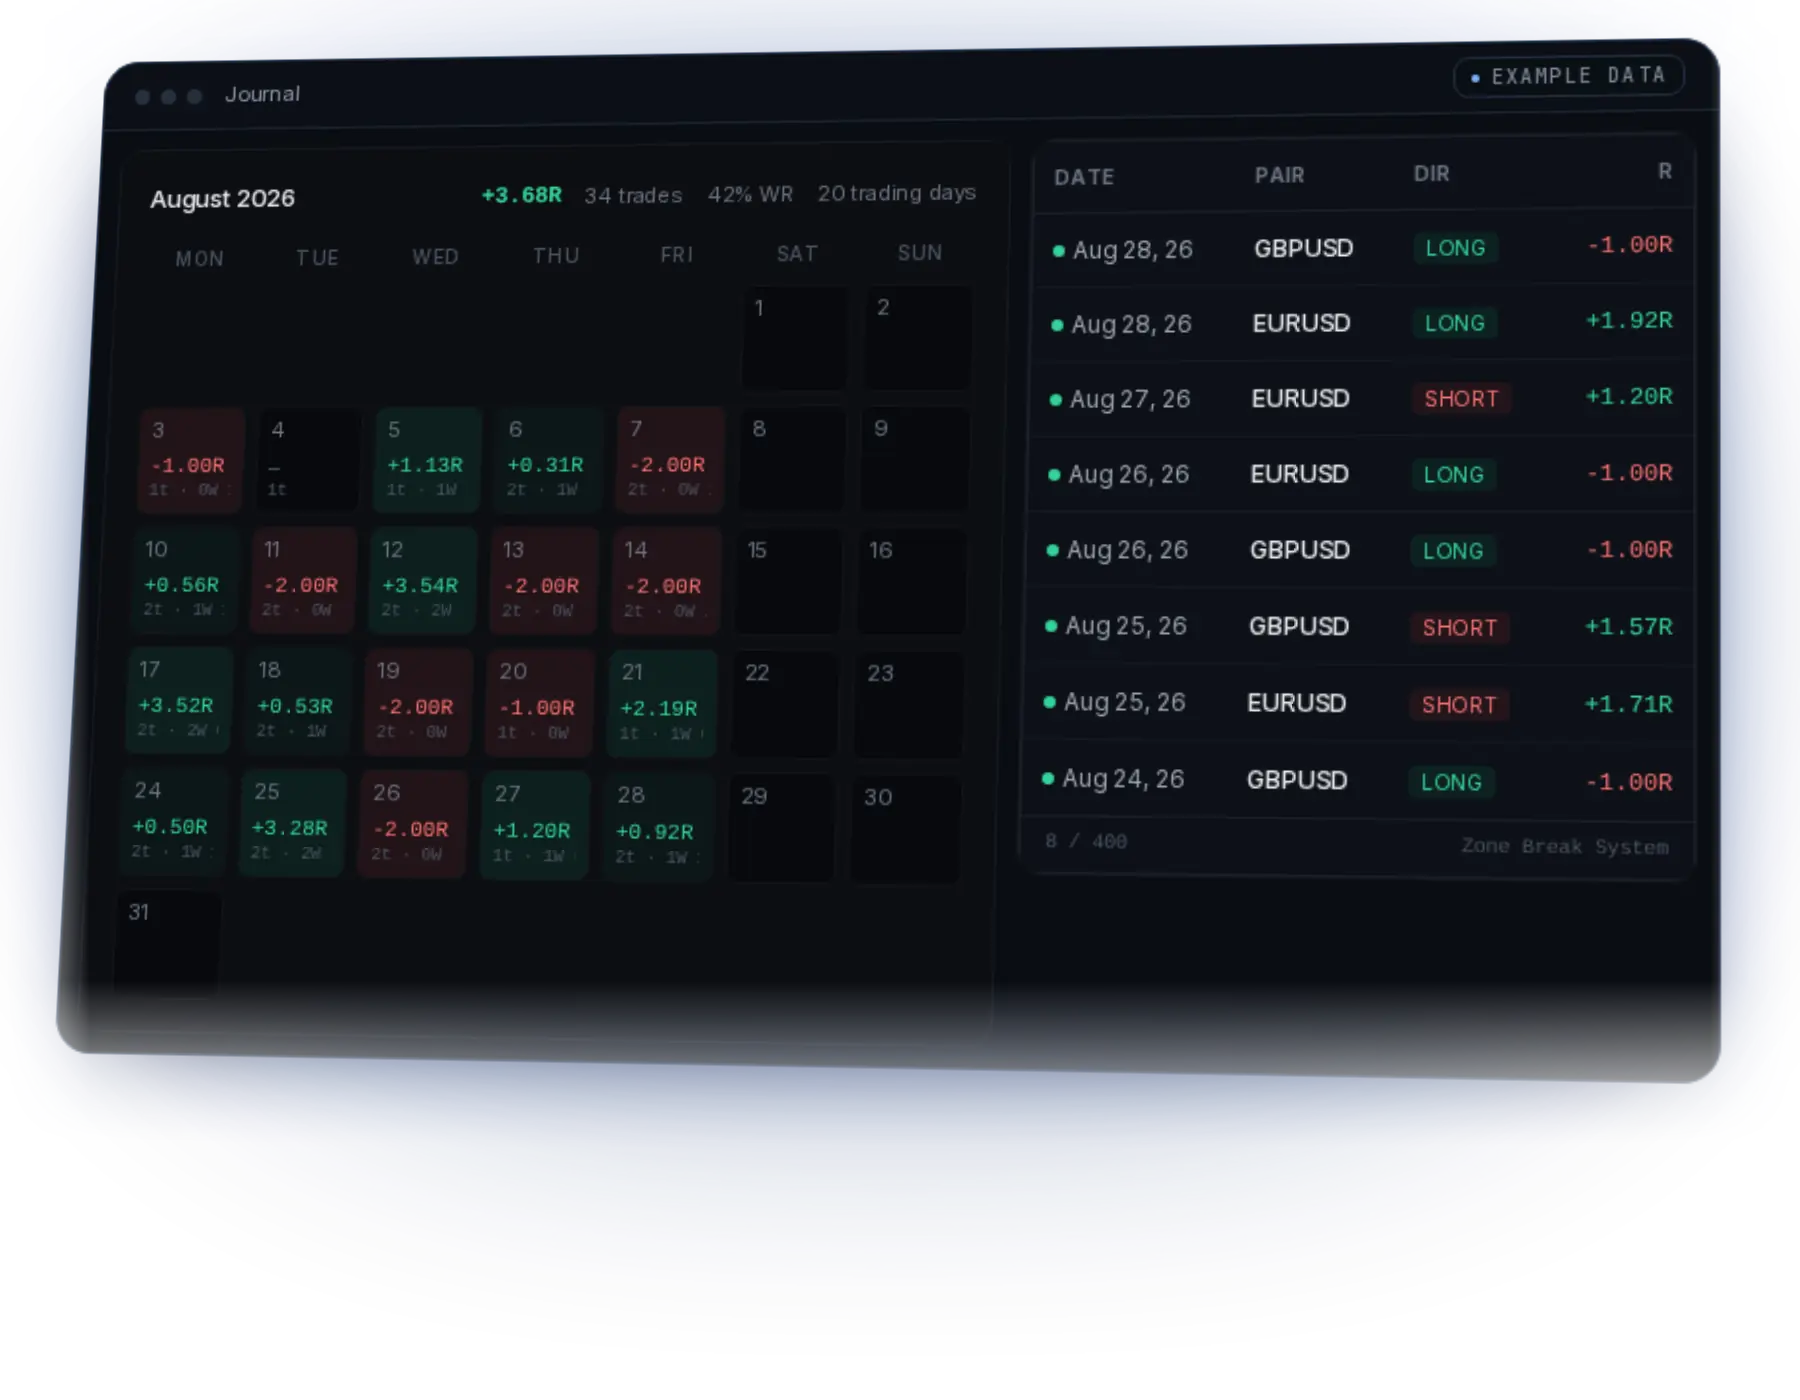
Every trade, with what you checked.
Tick the checks you looked at in a few clicks, also on your phone.
Learn moreBacktesting on TradingView charts
Test your plan on past charts, inside EdgeFlow.
Find your situation
Pick the one that sounds like you.
Stuck near break-even
“I journal every trade, and I’m still stuck at break-even.”
See which mix of your checks made money, and in which market.
See howProp firm traders
“I keep failing the same challenge.”
Psychology shows your longest losing run. Set your risk so the next one stays inside the firm’s limits.
See howNew or losing traders
“I can’t tell whether my strategy’s wrong or I am.”
See if you lose when you follow your plan, or only when you break it.
See howProfitable traders
“I’m profitable, but I don’t know which part works.”
See which setup made the money, and in which market.
See howCommunities and mentors
“My group posts trades ten different ways.”
Share one template, and everyone logs the same checks.
See howBefore you sign up
What EdgeFlow does for you.
What it does
- Works with your own checks, in any market and any style
- Tests your plan on new trades only
Built by Milo Maebe, a trader in Belgium. His journal showed his win rate, but not what made his good months good. He built EdgeFlow to find that in his own trades.
Meet MiloFree for every trader
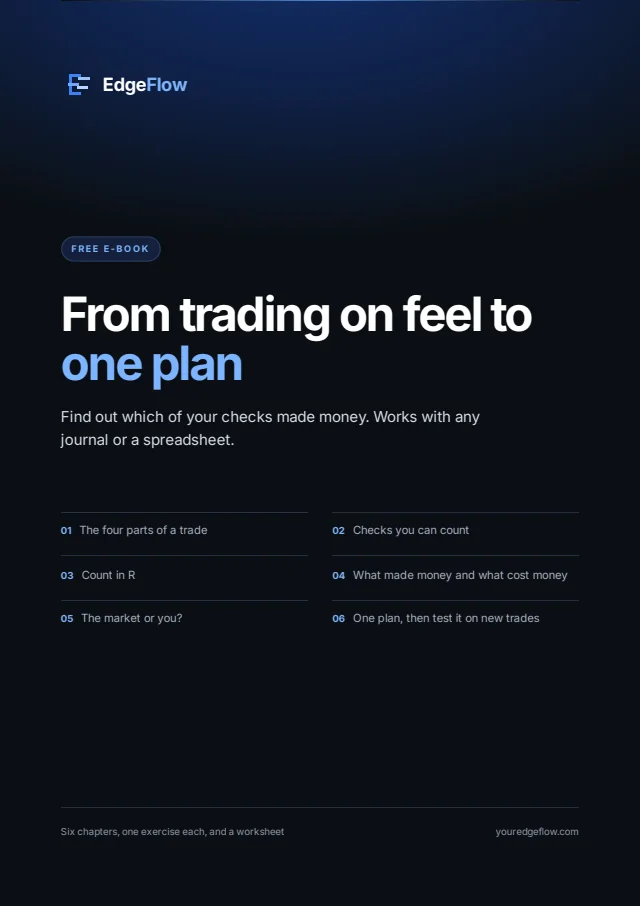
Not ready yet? Start with the free e-book.
Work out which checks made you money, by hand.
Works with any journal, even a spreadsheet.
Pro
$31.50/month
Billed yearly: $378 · save 30%
VAT included
What's in Pro
- Four layersEvery trade in four parts: setup, market, entry and after entry, so you see which part makes your money.
- Edge BuilderSee which of your checks made you money and which cost you, in your own trades.
- Edge DiscoveryTurn the checks that paid into one plan you tick before every entry.
- PsychologistSee how likely each losing run is, how deep your drops go, and what you do after a loss.
- CommunityShare your checks as one template, and follow your group on a leaderboard in R.
Plus a complete trading journal: DashboardCalendarEvery accountImportFlow
Cancel any time. In the EU, you have 14 days to change your mind.
FAQ
Questions traders ask before signing up.
Your journal already shows your win rate. EdgeFlow shows which of your checks were on the winners, and puts the ones that paid on one plan.
Your results and your rules show from your first trade. Combinations of checks need more trades.
EdgeFlow works with your own checks. You see which ones were on the trades that paid, and in which market, then test them as one plan on new trades.
No, because your broker can't know which checks you looked at. Old trades come in from a CSV, and you tick the checks after.
You freeze the plan, and its test runs on the trades you take after that. Old trades can't make it look better.
Not right now. The demo walks through the whole method on an example journal.
In Settings, any time. You keep Pro until the period you paid for ends.
Yes, in your phone's browser. There's no app in the stores.